Tree diagnosis of the new generation
Municipalities and private owners are held liable for damages caused by their trees. Most often trees are broken or thrown because of decay by fungal infections. To avoid risks the safety of trees has to be assessed on a regular basis.
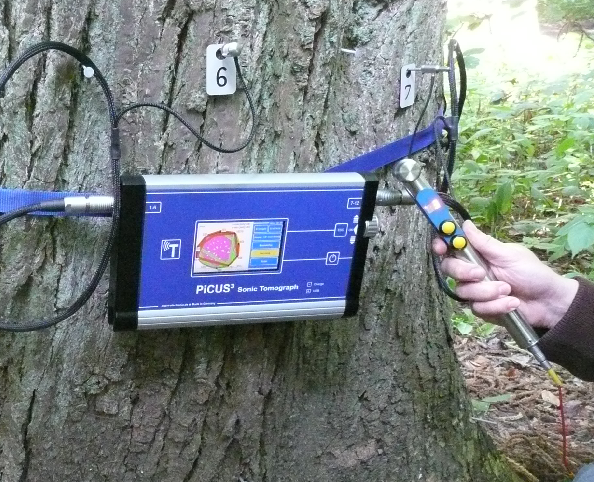
The PiCUS® Sonic Tomograph is an instrument to detect decay and cavities in standing trees non-invasively. The velocity of sound waves in wood depends on the modulus of elasticity and the density of the wood itself. The PiCUS unit tracks the speed of these waves. Most damage and disease causes fractures, cavities, or rot and reduces the wood’s elasticity and density.
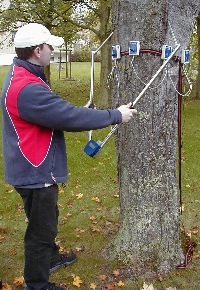
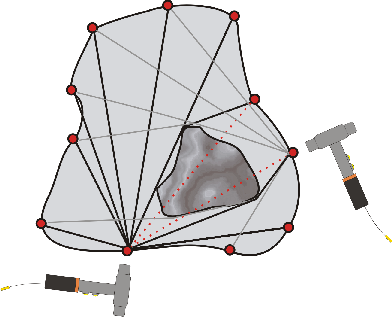
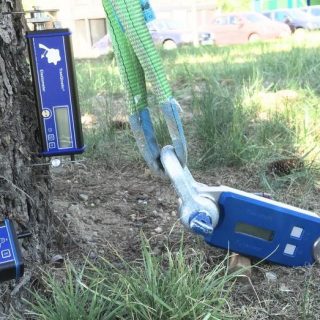
The PiCUS Sonic Tomograph consists of 5 to 20 sonic sensors. These sensors are spaced out evenly around the circumference of the trunk. They detect stress waves induced by manual impact and propagated through the wood. This sketch displays the basic working principle, in that sound waves cannot take a direct path through the wood (red dotted line) if there is a cavity between the transmitter and receiver.
Advantages
· Fast and easy to apply. Easy-to-understand tomograms on-site!
· Independent of noise levels
· Full resolution tomograms with very few sonic sensors by using the electronic hammer
· Nearly non-destructive
How to record a PiCUS Sonic Tomogram (SoT)
1. Determine the level, number, and positions of measuring points on the tree
To determine the measuring level, first conduct a thorough visual inspection of the tree and also a sound evaluation with the mallet. Look for external signs of internal defects, such as fungus growth, cracks, cavities, damaged bark, etc. Use all of your knowledge about trees and diseases and choose the measuring level according to your visual assessment of the tree.
2. Measuring the geometry of the tree at the measuring level
There are several ways to enter the geometry of the tomography test level.
· Simple circular geometry
· Elliptical geometry
· Free shape geometry – Triangulation
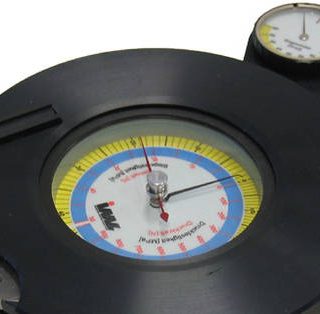
The PiCUS Calliper can efficiently carry out the triangulation measurements needed to calculate the exact positions of each measuring point. Using the electronic PiCUS calliper allows you to plot any tree shape quickly and accurately.
3. Taking sonic measurements
The sonic impulse is generated on each measuring point (nail) and recorded on the sensors at the other points. The electronic hammer (photo on the left) allows to use fewer sonic sensors than measuring points. This enables you to use smaller PiCUS systems in a fully functional manner.
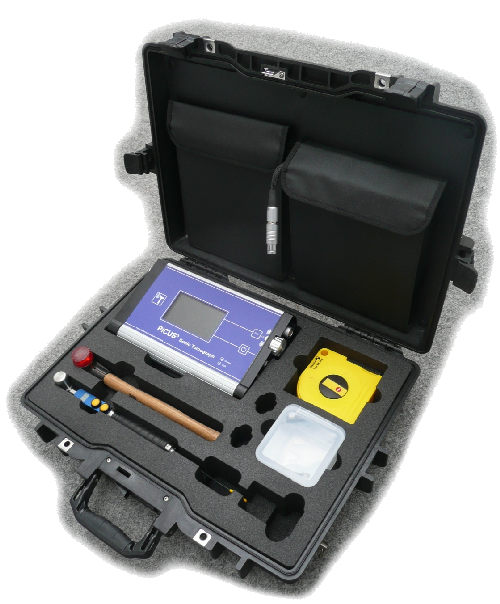
The PiCUS equipment is supplied with a robust box.
4. Calculating a Tomogram
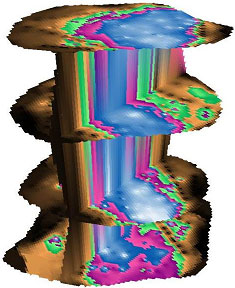
The sonic tomogram of a tree can be calculated on site using a number of functions for data analysis and presentation. Size and location of defets is shown using distinct colours. Tomograms of a tree can be displayed in 3-dimensional graphics.
There are assistance-functions that help to analyse the tomogram. The tomogram (jpg-image) can by copied into other programs.
The PiCUS Sonic Tomograph can be used for trees even larger than 2 m (6,5 ft.) in diameter.
The largest tree we have ever tested was this sequoia sempervirens (a redwood in California), which was over 5 meters in diameter. The image shows a test by argus electgronic and Philip van Wassenaer (www.ufis.ca) on that tree. To take the measurements, we placed 66 MP but only needed to use 16 sensors.
Limitations
Cracks in wood are real barriers for the sonic waves. They appear in the tomogram much larger than they really are and may thus lead to incorrect conclusions about the tree. To identify “star shaped” cracks, the PiCUS software contains a CrackDect Function. We also recommended using other inspection methods, such as the Treetronic electric impedance tomography.

